Turn Toward
the Light
Sunflower turns Data into Understanding, from mere Information to Knowledge with engaging visualizations and complementary educational tools.
See Past the Headlines.
Sunflower filters out the noise and shows you the dataset behind every headline — pick your lenses and check the numbers yourself, in one tap.
Get to know
the World
Compare data over years or drill straight down into specific neighborhood metrics. All calculations adapt dynamically to keep the final comparison honest.
Knowledge in
Plain Sight

Up To 0%
Find government statistics hard to understand — and 77% say they're difficult to find. Sunflower fixes both: data that used to take hours to track down is now surfaced in one search, clearly visualizations with contextual explanations so anyone can make informed decisions.
Fromopaquetablestoinsightinafewtaps
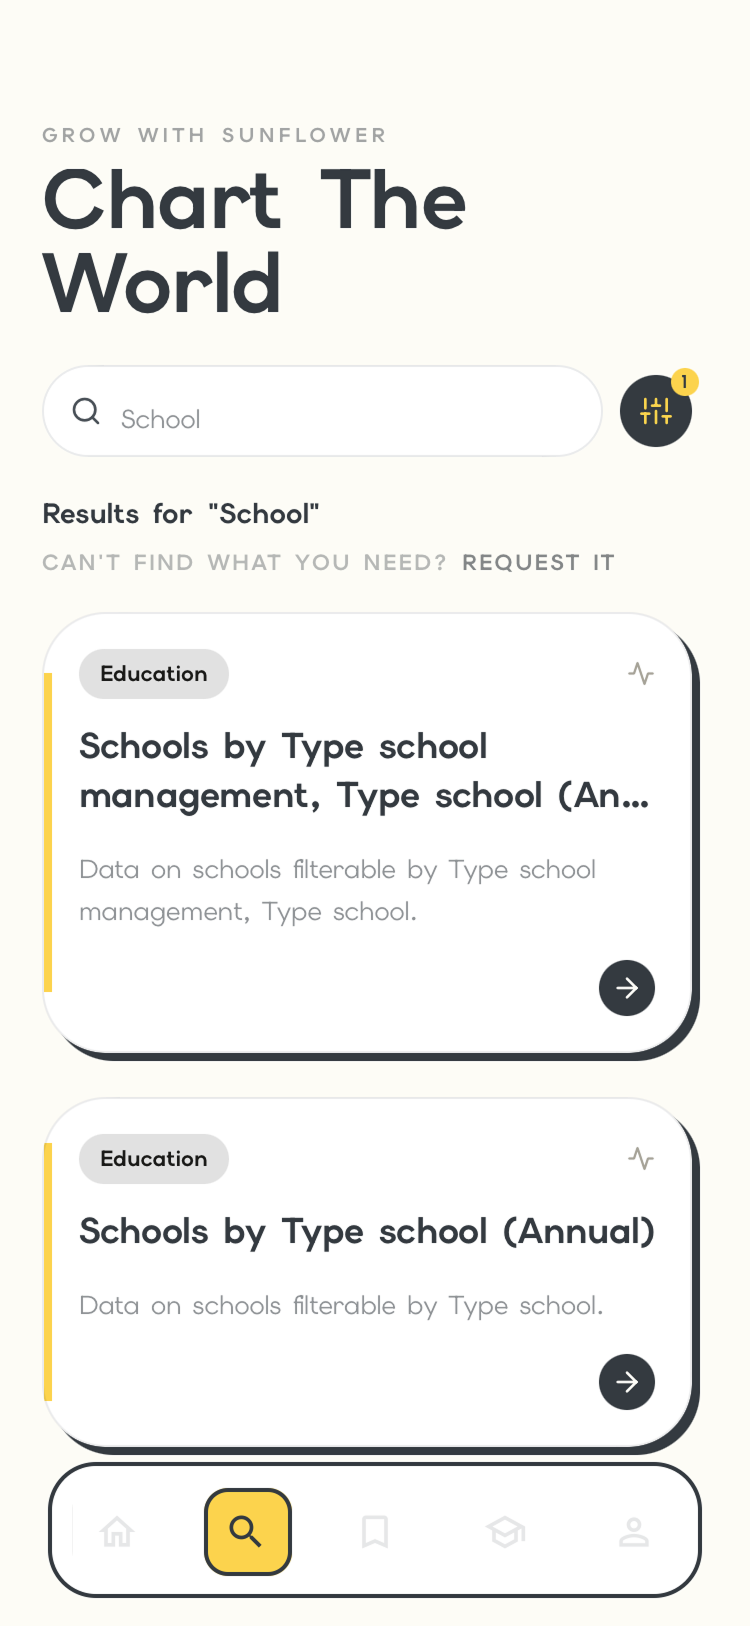
Semantic search across public datasets
No technical query skills needed — ask in plain language and Sunflower finds the dataset that answers it.
Instant visualization
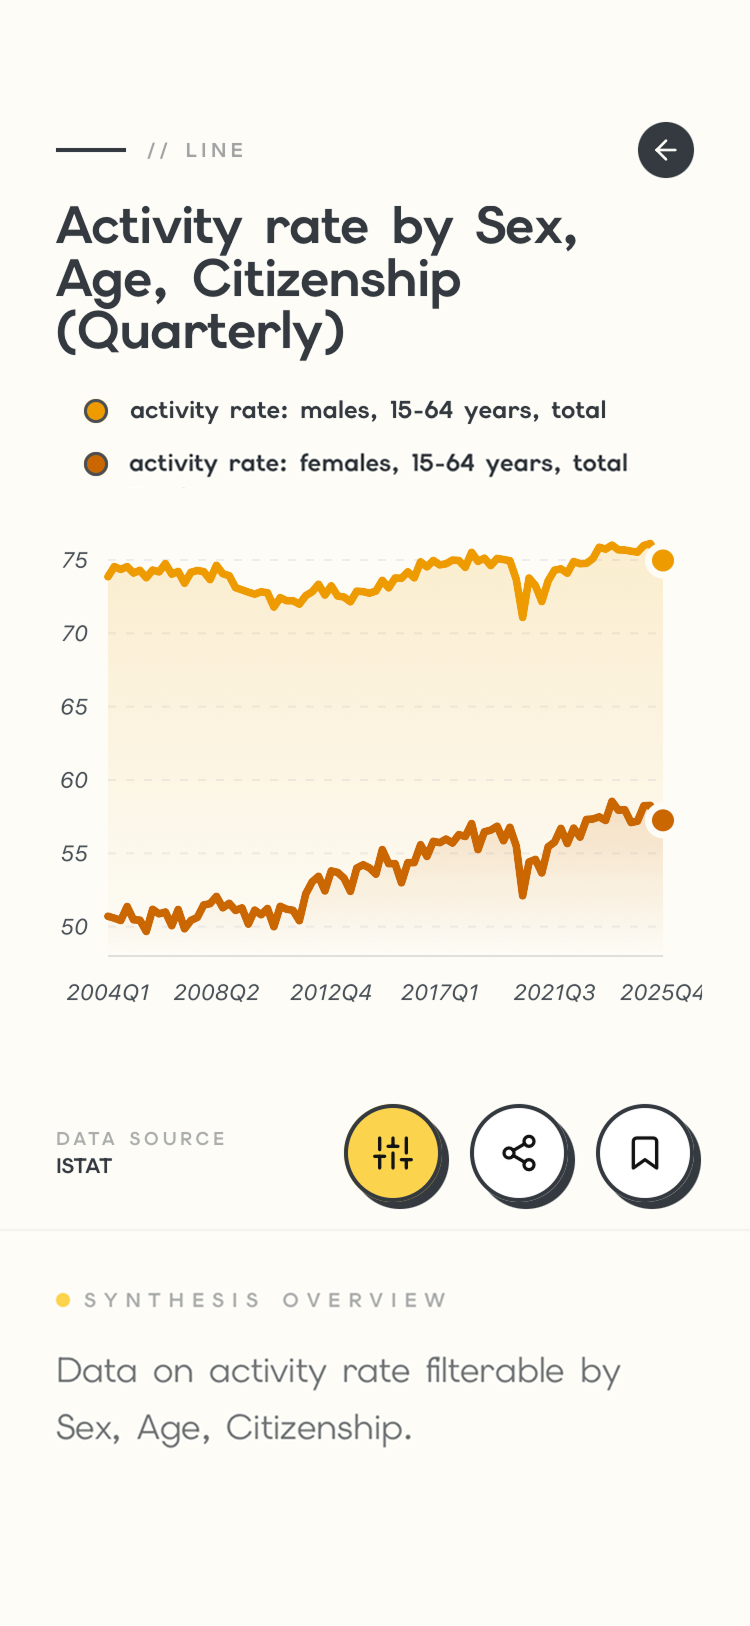
Interactive charts, automatically generated the moment you find the data — no spreadsheet setup, ever.
Contextual explanations on every chart
Every visualization comes with the context it needs, preventing the kind of misreading that spreads misinformation.
Gamified learning
Built on literacy-education best practices, so what you learn about your world actually sticks.
WhySunfloweristherightinstrumentforthenowadayslife?GlobalPerspectivesonData,Transparency,andCivicUnderstanding.
Questions before you turn toward the light? Here are the ones we hear most. Still curious? Reach out — we're here to help.
Is Sunflower free?
Yes. Browsing the data, the charts, and the core learning tools is free — no account required. We believe the same facts should be reachable by everyone, not just people who can pay.
Where does the data come from?
Verified sources only: Eurostat, ISTAT, municipal and government records, and independent data journalists and think tanks. Every chart traces back to a public, checkable source — nothing is generated or guessed.
Why charts instead of raw datasets?
Because open data that nobody can read isn't really open. Sunflower turns public tables and files into visuals anyone can understand in seconds — no spreadsheet skills required.